
Last updated Jun 11, 2026.
Stop Guessing. Compare AI Models Side-by-Side
8 minutes read

Shubham Tribedi
Every developer, researcher, and AI team running production workloads has lived through the same painful cycle: pick a model, build around it, ship something, then wonder - was this actually the right model?
Was there a cheaper option that performs just as well? Is a faster model available that wouldn't have added 20 seconds of latency? Did we pick the one with the best output quality, or just the one we'd heard the most about?
These aren't hypothetical questions. They're expensive guesses that teams make every single day - because until now, there was no good way to run a fair, side-by-side evaluation without cobbling together your own scripts, calling multiple APIs manually, and still getting inconsistent results because you couldn't run the same prompt at the same time.
"The AI ecosystem has hundreds of models. Picking the right one shouldn't require a PhD in benchmarking. It should take 30 seconds."
That's exactly what we've built. Model Comparison is now live on Qubrid AI - and it fundamentally changes how you evaluate, choose, and trust the model powering your product.
The Problem Nobody Was Solving
Public leaderboards like MMLU, HumanEval, and HELM are useful - in a research context. But they don't tell you how a model behaves on your prompt, for your use case, at your price point.
You'd have to open four browser tabs, copy-paste the same prompt into each provider's playground, wait for each to finish at different times, then manually compare responses with no standardized metrics. And if you wanted cost data? Another spreadsheet. Latency? Another timer. Token count? Another calculation.
This is the workflow that's been accepted as "good enough" - and honestly, it's not. Not when your infrastructure decisions are riding on it.
The Real Cost of Getting This Wrong: Choosing the wrong model can mean 4× higher API costs, 2× slower response times, or both - without even knowing it. Teams that switch models mid-project lose weeks. The right evaluation tool at the start pays for itself immediately.
Introducing Model Comparison on Qubrid AI
Model Comparison lets you select between 2 and 4 AI models, enter a single prompt, and see everything play out in real time - responses streaming live, metrics populating as each model finishes, and a full analytics layer you can dig into.
No more tabs. No more spreadsheets. No more guessing.
What Model Types Are Supported
We've built Model Comparison to cover the models teams actually use in production:
Type | Description |
|---|---|
📝 Text Models | General-purpose instruction and chat models |
👁 Vision Models | Multimodal models that accept image input |
💻 Coding Models | Models optimized for code generation and debugging |
🔍 OCR Models | Models built for document and image text extraction |
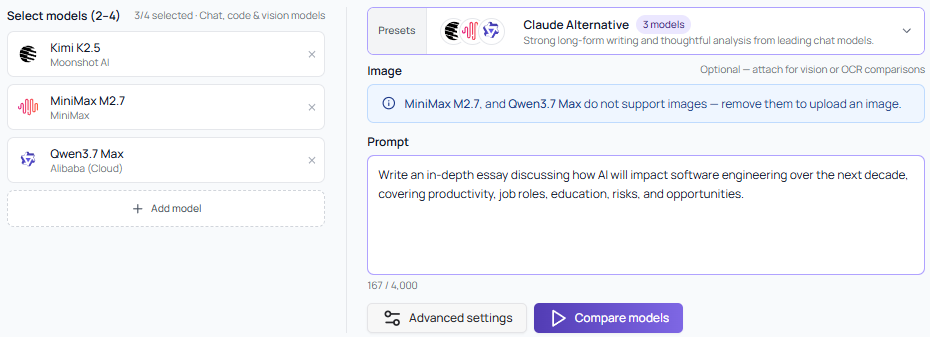
Mix and match across types to find the best fit for your task. Running vision models? Optionally attach an image. Need to evaluate reasoning depth? The response cards expand to show full outputs, and DeepSeek V4 Pro's built-in Thinking mode surfaces transparently in the comparison.
Everything You See, In Real Time
The moment you hit Compare Models, all selected models receive the same prompt simultaneously. Responses stream live into side-by-side cards. Here's what's tracked:
Live Response Cards
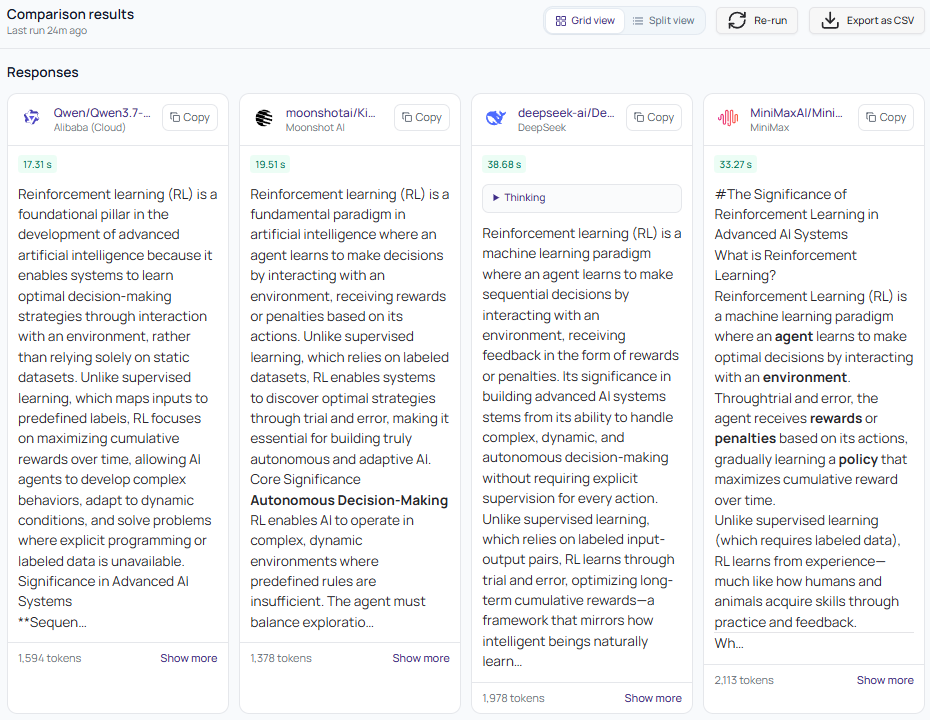
Streamed output from each model as it generates - no waiting for all to finish
Token counts shown per response (prompt + completion tokens)
Thinking mode surfaces for models that use chain-of-thought reasoning
Expandable "Show more" to read the full output
Fine-Tune Before You Run - Advanced Parameters
Not all comparisons are equal, and neither are all use cases. Before hitting Compare Models, you can dial in the exact parameters that matter for your task - applied uniformly across every model in the comparison:
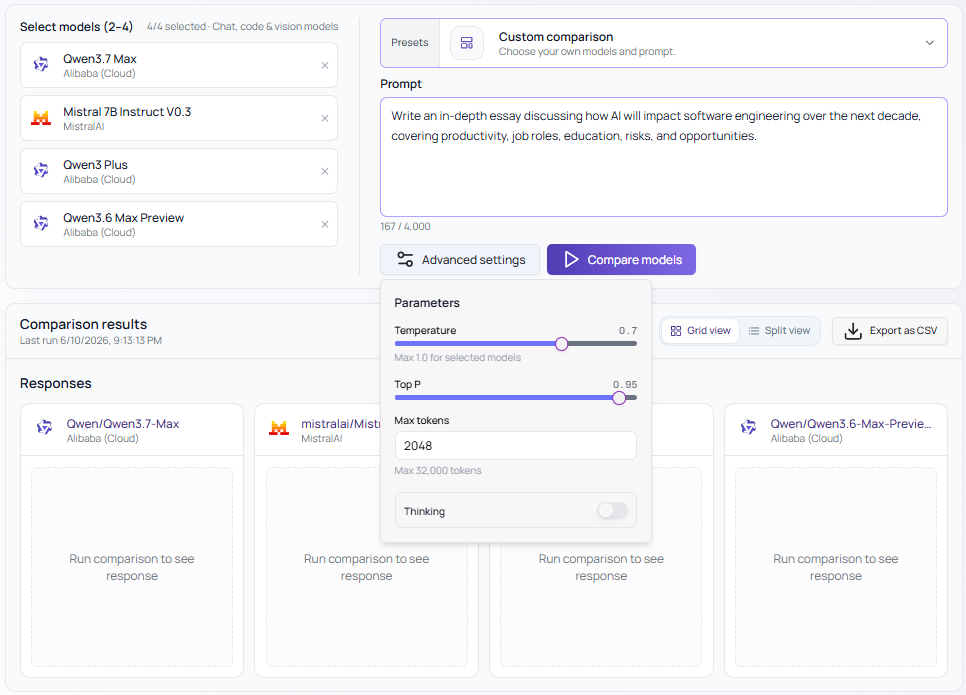
Temperature (0 to 1.0) - Control creativity vs. precision. Turn it down for factual, deterministic outputs; turn it up for creative or exploratory tasks.
Top P (0 to 1.0) - Fine-tune nucleus sampling to shape how the model picks its next token.
Max Tokens - Set the output ceiling, up to 32,768 tokens depending on the model.
Thinking Mode - Toggle chain-of-thought reasoning on or off for models that support it (like DeepSeek V4 Pro).
Same prompt. Same parameters. Every model on equal footing - so you're comparing the models, not accidentally comparing your settings.
The Metrics Table
Below the responses, a clean metrics table gives you the hard numbers side by side:
Model | Throughput | Latency | Tokens | Est. Cost |
|---|---|---|---|---|
Qwen/Qwen3.7-Max | 55.54 tok/s ✓ | 17.31 s ✓ | 1,594 | $0.0082 |
moonshotai/Kimi-K2.6 | 36.89 tok/s | 19.51 s | 1,378 ✓ | $0.0031 |
deepseek-ai/DeepSeek-V4-Pro | 34.21 tok/s | 38.68 s | 1,978 | $0.0053 |
MiniMaxAI/MiniMax-M3 | 41.08 tok/s | 33.27 s | 2,113 | $0.0018 ✓ |
Best Per Metric - Instant Winners

We automatically surface the best performer for each metric so you don't have to eyeball it:
Best TTFT - Fastest time to first token, critical for chat-like UX
Lowest Total Latency - End-to-end response completion time
Fewest Prompt Tokens - Which model's tokenizer is most efficient on your input
Fewest Completion Tokens - Most concise output for the same quality
Fewest Total Tokens - Combined prompt + completion efficiency
Highest Throughput - Tokens per second during generation
Lowest Input Cost - Cheapest model for ingesting your prompt
Lowest Output Cost - Cheapest model for generating the response
Response Length - Character count, useful for content-heavy tasks
Visualizations That Tell the Full Story
Numbers in a table only get you so far. The visual comparison layer is where things click.
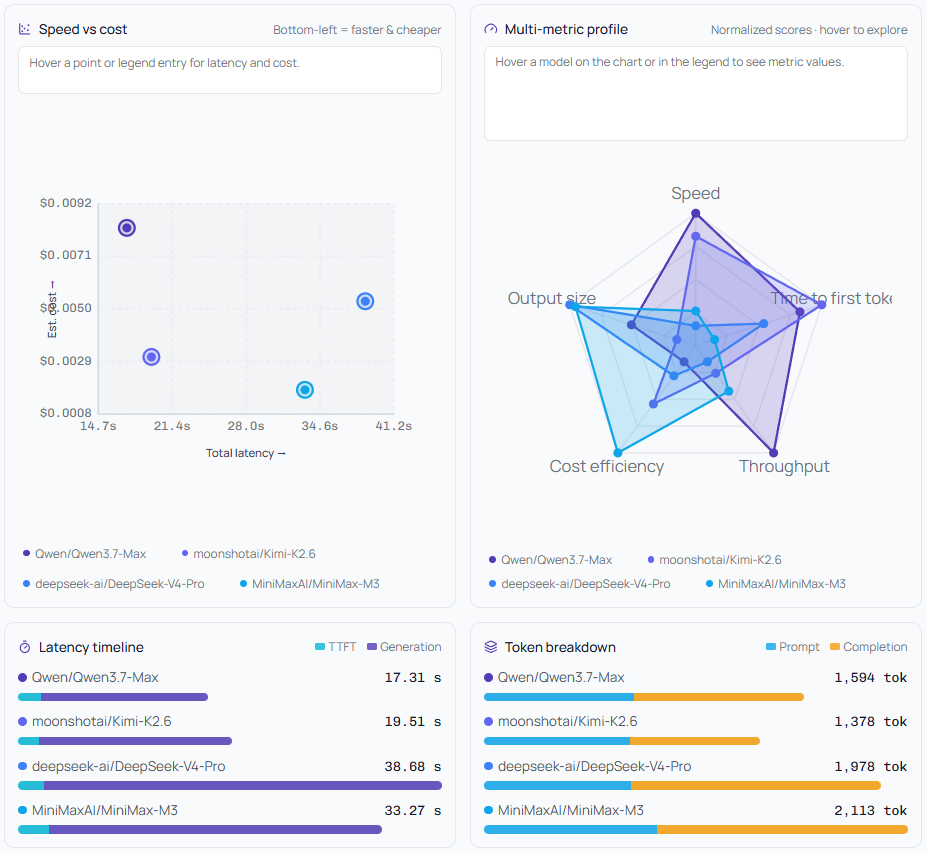
Speed vs. Cost Scatter Plot
Every model is plotted on a two-axis chart: latency on the X-axis, estimated cost on the Y-axis. The bottom-left quadrant is where you want to be - fast and cheap. At a glance, you can see if a cheaper model is actually comparable in speed, or if you're paying a premium for marginal gains.
Multi-Metric Radar Profile
A spider/radar chart normalized across five axes: Speed, Time to First Token, Throughput, Cost Efficiency, and Output Size. Each model gets its own polygon. Overlap it with another model's polygon and you immediately see the tradeoffs. A model might win on throughput but lose badly on cost efficiency - the radar makes that visible in one shape.
Latency Timeline
A visual breakdown of each model's total latency split into TTFT (time to first token) and generation time. This matters: a model with similar total latency but fast TTFT will feel much snappier to an end user than one with slow TTFT, even if both finish at the same wall-clock time.
Token Breakdown Bar Chart
Prompt tokens vs. completion tokens side by side, per model. Some models count the same input as significantly more tokens - and that adds up at scale. See it clearly before you commit.
The Full Metrics Table - No Hiding
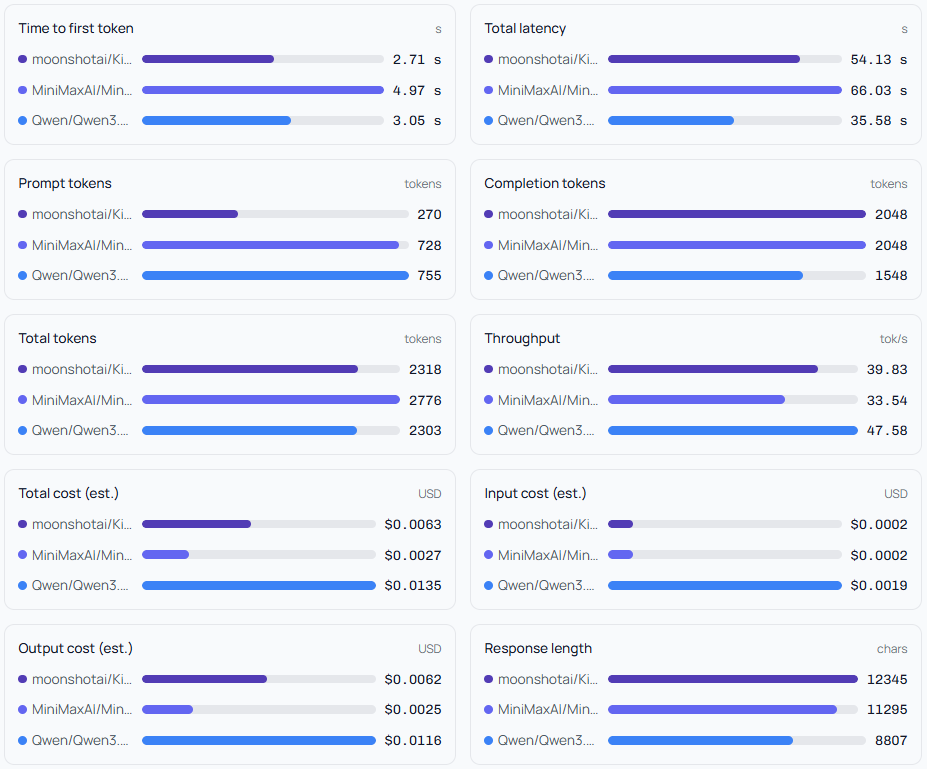
For the analysts and the obsessive optimizers, every data point is available in the All Metrics table. Nothing is hidden. You get:
Cached input price per 1M tokens, input price, output price
Completion tokens, prompt tokens, total tokens - with reasoning token breakdowns where available (e.g. DeepSeek's 52 reasoning tokens)
Input cost estimated, output cost estimated, total cost estimated
Finish reason per model (
stop,length, etc.)Cached token usage - relevant for repeated prompts at scale
Response length in characters
Tokens/sec throughput and time to first token
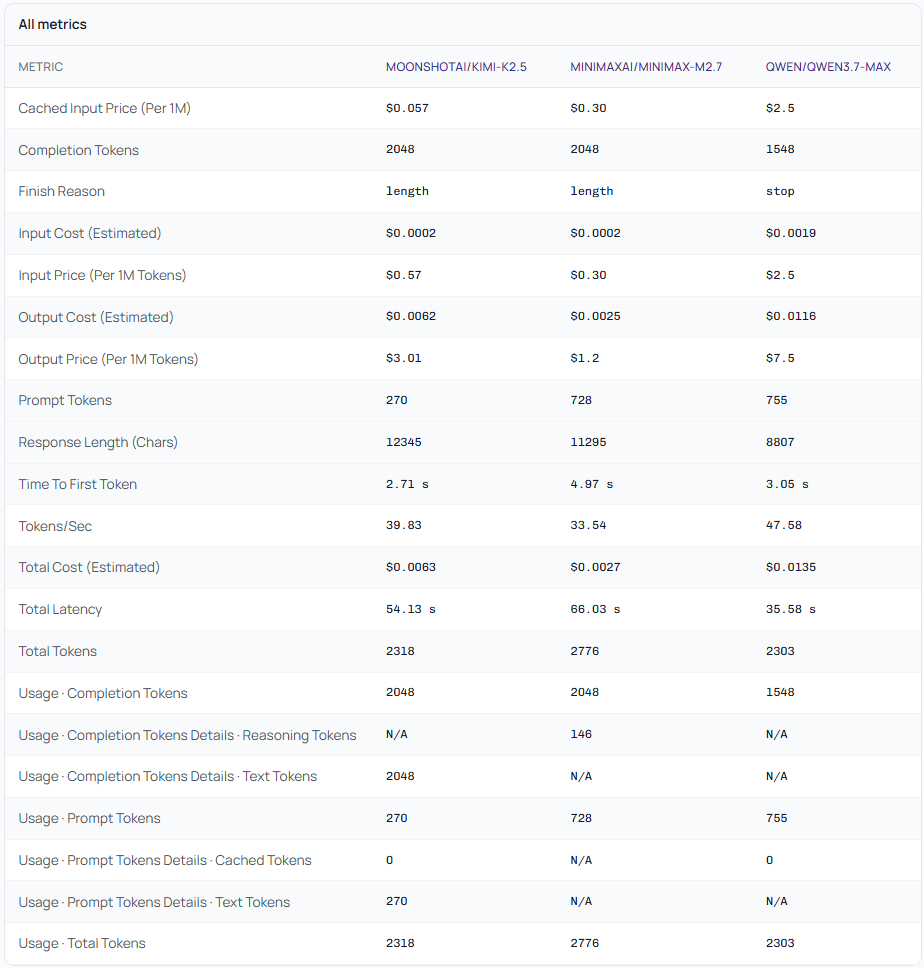
Export the full comparison as a CSV for your records, stakeholder reports, or feeding into your own cost models.
Who This Is Built For
Engineering teams evaluating which model to integrate into a new product feature - before writing a single line of production code.
AI researchers who need reproducible, same-prompt comparisons across models without building their own harness scripts.
Startup founders who care deeply about API cost at scale and need to know if a cheaper model is genuinely viable - not just theoretically cheaper on a per-token basis, but actually good enough on real prompts.
Enterprises running procurement evaluations who need documented evidence of model performance, not just vibes and vendor pitch decks.
"If you're making an infrastructure decision that will touch thousands or millions of requests, running a 30-second comparison first is the most valuable 30 seconds you'll spend."
This Is Just the Start
Model Comparison launches today with support for text, vision, coding, and OCR models - and we're moving fast. On the roadmap: batch prompt testing, saved comparison history, team sharing, and scoring rubrics so you can evaluate quality beyond just speed and cost.
The AI landscape is moving at a pace where a model released six months ago may already be outclassed. You need a tool that keeps up - one that lets you re-run your evals whenever the landscape shifts, not just when you're initially building.
Model Comparison on Qubrid AI is that tool. It's live. And it's the fastest way to make a confident AI model decision.
Related posts
View all posts
Kimi K3 vs Qwen3.8-Max: The Complete Technical, Benchmark and Pricing Comparison
Two of the largest open-weight models ever built shipped within eighteen days of each other.
 Shubham Tribedi
Qwen 3.8 Max API Is Now Live on Qubrid AI: Benchmarks, Pricing, and How to Actually Run It
Alibaba's 2.4-trillion-parameter flagship is available on Qubrid AI from day zero. Here is the full benchmark breakdown, the honest read on what the numbers mean, Qwen 3.8 Max pricing, and production-ready integration code.
Shubham Tribedi
How to Run Kimi K3 on Hermes Agent
Run Moonshot AI's Kimi K3 inside Hermes Agent using Qubrid's OpenAI-compatible API. Full setup, code examples, pricing ($3/M input), and vision support. Live in 10 minutes
Shubham Tribedi